01 · Analytics application · Power BI · Personal project
Claims Performance Hub
Turning governed Power BI analytics into operational action.
Power BI · Semantic model · Lovable · PostgreSQL · RLS · Application logic
The challenge
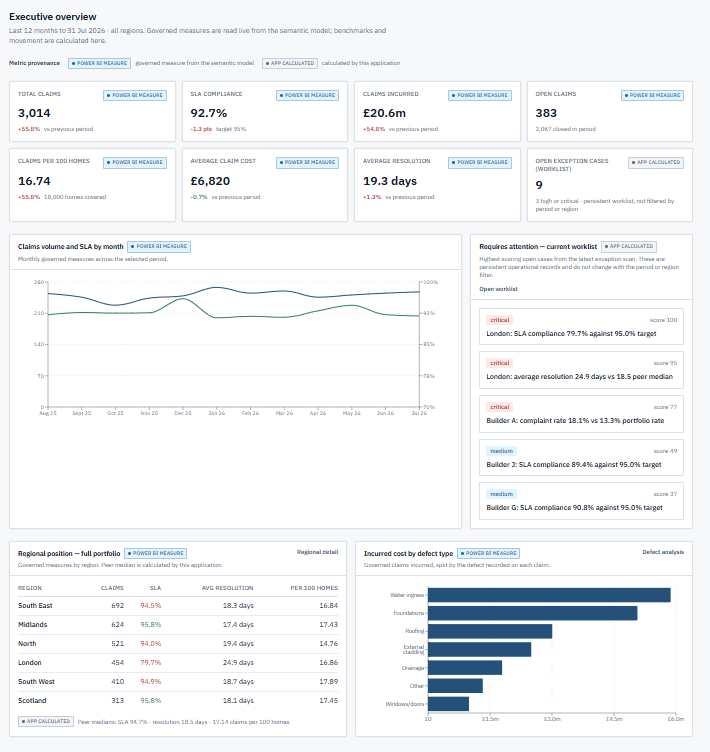
The design question behind Claims Performance Hub was straightforward: how can a governed BI semantic model be extended beyond reporting so that analytical signals lead directly to operational action? A dashboard can reveal that performance is outside tolerance, but the next steps often happen somewhere else — in messages, spreadsheets or disconnected task lists. That separation weakens ownership and makes it harder to see whether an exception is being addressed.
The starting point was my existing personal Haven Warranty Analytics project and its governed claims semantic model. That model already defined the measures and dimensions needed to understand claims performance. Claims Performance Hub explores what can be added around that trusted analytical foundation without rebuilding it or creating a competing version of the numbers.
Why not simply build another dashboard?
Power BI remains the governed analytical layer. Its role is to hold the claims measures, business definitions and dimensional context used for reporting. Reproducing those measures in another technology would introduce duplication and the risk that two implementations of the same metric would drift apart.
The objective was therefore not to recreate the Power BI report as an application. It was to add capabilities better suited to operational work: detecting exceptions, creating persistent cases, assigning ownership, setting priorities and target dates, moving work through statuses, and recording notes. The application reads the governed measures live, interprets them against explicit rules, and provides a place for action to continue after the analytical view has changed.
Architecture
The design separates analytical governance, application intelligence and operational state. Each layer has a distinct responsibility rather than allowing the application database to become a second analytics platform.
Power BI semantic model
Holds governed claims measures and business definitions across regions, builders, cover types, defects and time dimensions. The application queries these measures live. Claims analytics are not copied into the application database.
Claims Performance Hub
Adds peer benchmarking, period-on-period calculations, exception detection and severity scoring, then presents the resulting signals through an operational workflow.
Application backend
Provides authentication, Claims Manager and Executive roles, and persistent records for exception cases, owners, statuses, target dates and notes.
This boundary matters. Analytical selections such as period and region can change as a user investigates performance, while an operational case must remain stable, traceable and available to the people responsible for resolving it.
Metric provenance
The interface deliberately distinguishes between Power BI measure and App calculated. A Power BI measure is a governed value read from the semantic model. App-calculated values include peer benchmarks, comparisons, exception scores and other interpretations produced by application logic.
These provenance labels appear directly alongside metrics and sections in the interface. The distinction makes it clear which values come from the governed model and which are derived for the application's operational purpose. It also prevents a polished interface from obscuring where a number was defined.
From insight to exception
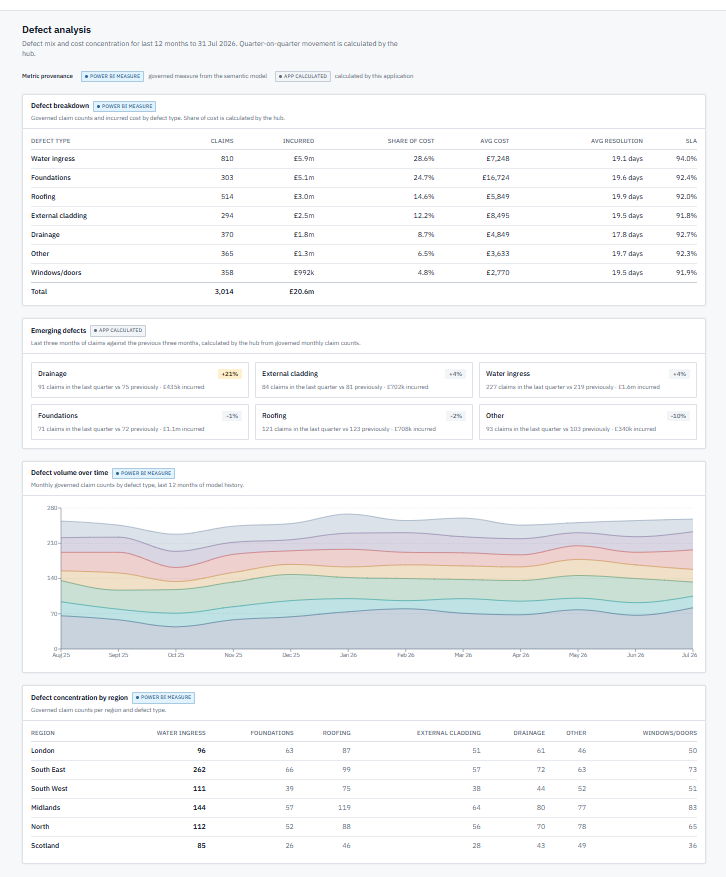
London provides a concrete demonstration. The governed Power BI measures report SLA compliance of 79.7% against a governed 95.0% target. Those values originate in the semantic model. The application applies its detection rule, identifies the breach, calculates a severity score and creates an operational exception.
This is the transition from observation to action. The governed result is not altered, and the application does not claim ownership of the underlying measure. It adds an explicit, inspectable interpretation: this result falls below the agreed threshold and should enter a managed workflow. All values shown in this project are synthetic demonstration data and do not represent a real organisation.
Operational workflow
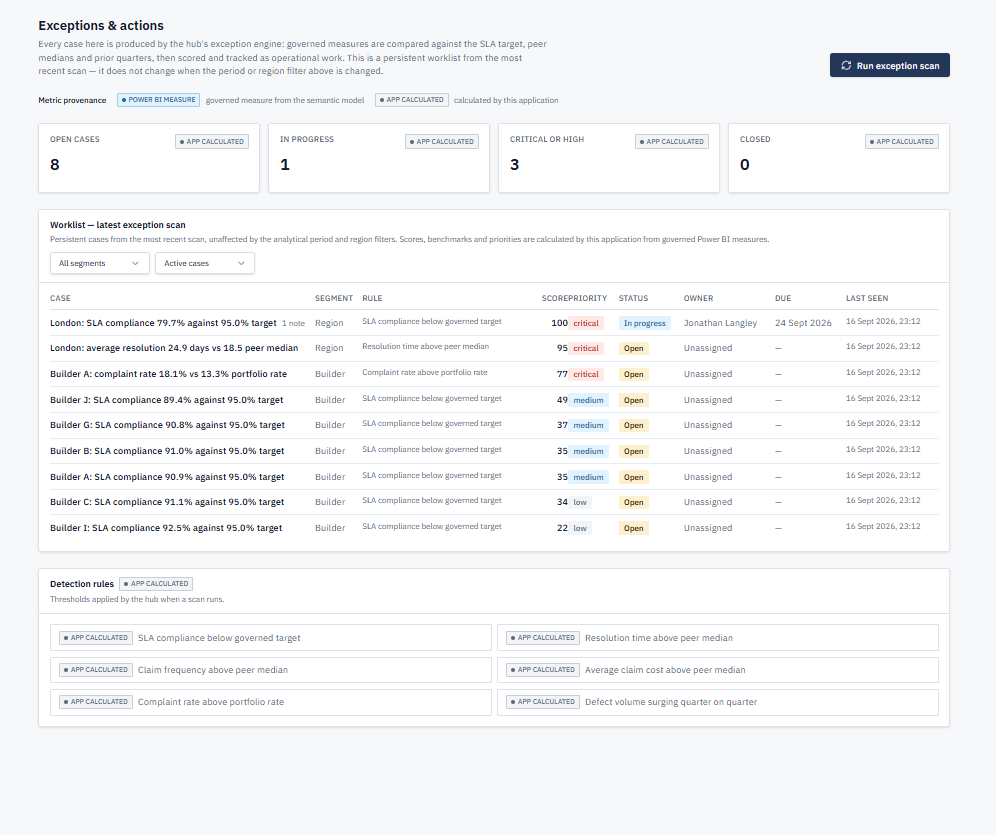
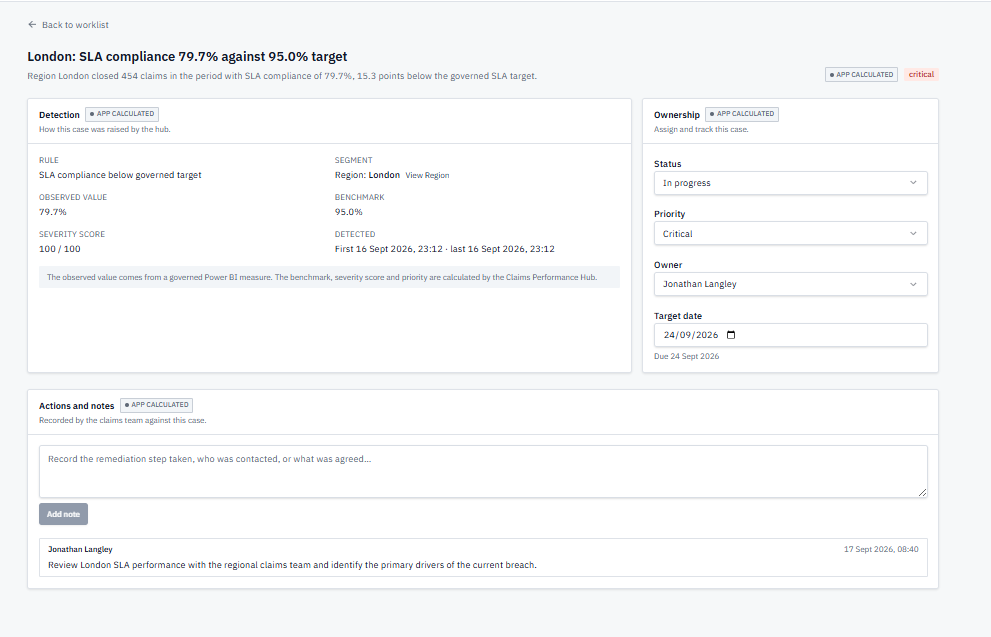
Once detected, an exception becomes a persistent case. A Claims Manager can take ownership, set its priority and target date, move it through the available statuses, and add remediation notes. That record remains available independently of the analytical period and region filters used elsewhere in the application.
Persistence changes the nature of the experience. A user is no longer only reviewing a snapshot; they can see what has been acknowledged, who owns the response, what is due and what action has already been recorded. Re-running the exception scan updates the analytical assessment without discarding the operational history attached to an existing case.
Role-based access
The demonstration has two provisioned roles. A Claims Manager can access the analytical views, run exception scans and manage case actions. An Executivecan review the same analytics and operational position with read-only case access.
Authorization is enforced in the backend and database rather than relying only on disabled controls in the interface. This means the rules governing who can change an owner, status, priority, target date or note remain effective even if a request does not originate from the visible application controls.
Security and governance
Security hardening included least-privilege database access and row-level security. Users cannot promote themselves to Claims Manager, read another user's personal profile or email data, or access cases unless they are provisioned for the application. Privileged database routines are restricted to the roles that require them.
Dependency vulnerabilities were scanned and remediated. The final security scan reported no active issues, with one documented and accepted SECURITY DEFINER warning for tightly scoped authorization and name lookup. The final dependency scan reported zero known issues. These controls strengthen the demonstration, but they are not presented as formal production certification.
Outcome
Claims Performance Hub demonstrates a practical pattern for extending governed enterprise BI into an operational tool without replacing or duplicating the semantic layer. Power BI remains responsible for trusted claims measures. Application logic turns those measures into transparent benchmarks and exceptions. Persistent workflow gives those exceptions owners, priorities, dates and a record of action.
The project connects the disciplines behind executive reporting and operational delivery: governed analytics → application intelligence → operational action.
Scope
A personal portfolio project, not a client engagement. The live application is an internal demonstration using synthetic claims data, and access is controlled. It is not presented as a formally certified production system or as evidence of claims-domain expertise.